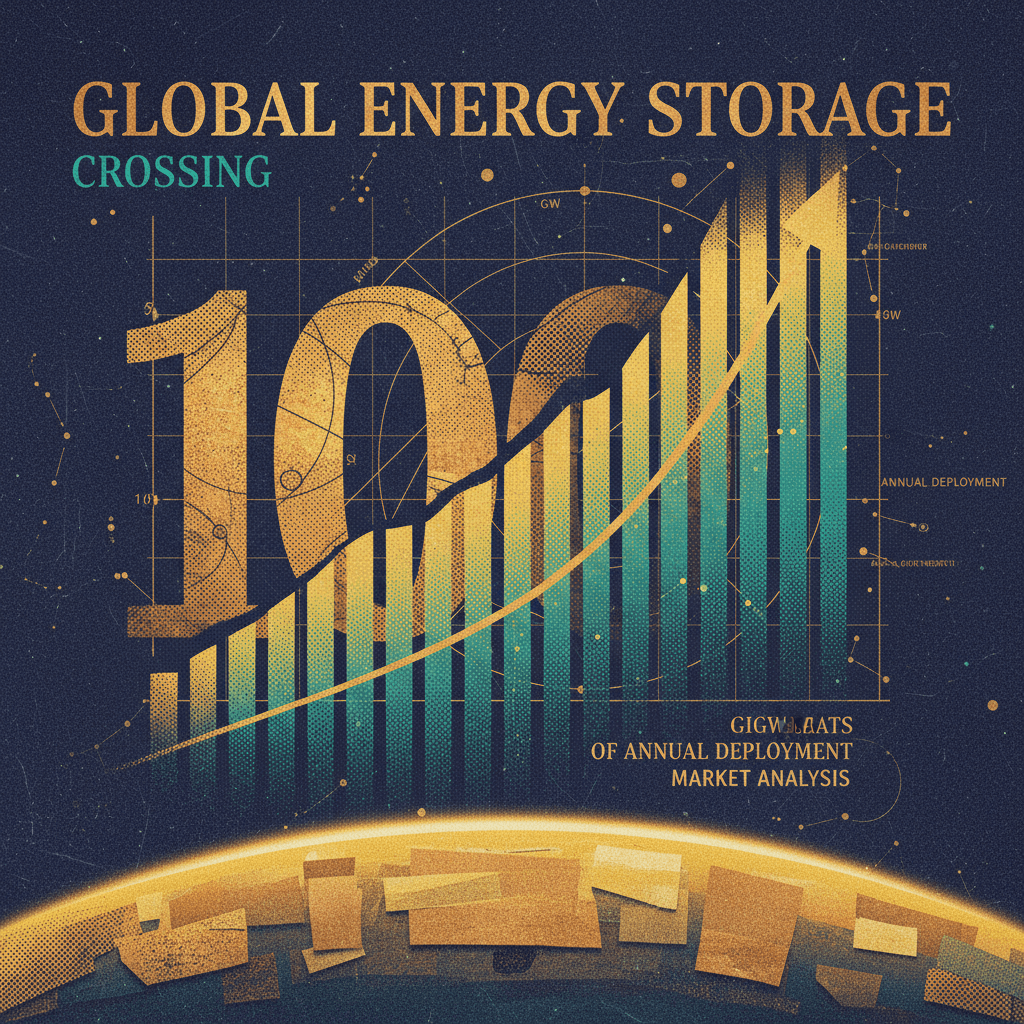
Global energy storage deployment crossed a threshold that the industry had been approaching for nearly a decade. According to a BloombergNEF analysis published on May 7, 2026 by Senior Associate Isshu Kikuma, annual energy storage additions reached 112 gigawatts in 2025 — a 48% jump over 2024 and the first year on record that the sector exceeded 100 GW of annual deployment. The same analysis put 2025 capacity additions at 307 gigawatt-hours, and forecasts roughly 158 GW in 2026 and 308 GW by 2036.
For developers, financiers and utilities watching this market evolve, the BNEF numbers are not just a milestone — they reset the planning baseline. Storage is now scaling faster than solar did at a comparable inflection point, and the chemistry mix is set to broaden in ways that will reshape procurement and project economics through the rest of the decade.
How fast did this happen?
The pace at which storage hit 100 GW of annual additions is the headline that most industry observers latched onto, and it deserves the attention. According to BloombergNEF's analysis, it took energy storage just four years to scale from 10 GW to more than 100 GW of annual additions. By the same yardstick, solar took roughly eight years and wind took fifteen.
That is not just a curiosity. The compression of the deployment timeline reflects a more mature ecosystem than solar enjoyed at the equivalent stage: standardized engineering, an established financing playbook, vertical integration in cell manufacturing concentrated in China, and a clearer policy story in major markets. It also reflects the fact that storage was not, in most cases, building a market from scratch — it was attaching itself to a renewables buildout that already had momentum.
| Year | Annual storage additions (GW, ex-pumped hydro) | Notes |
|---|---|---|
| 2024 | ~76 GW (implied from BNEF 48% YoY) | Prior record |
| 2025 | 112 GW / 307 GWh | First year above 100 GW |
| 2026 (forecast) | 158 GW | ~41% YoY growth |
| 2036 (forecast) | 308 GW | BNEF base case |
Where the gigawatts are going
China dominates the deployment picture: the country accounted for 54% of additions in 2025, with the United States contributing 16%. The third tier is where the more interesting story sits.
Australia's deployment rose nearly sixfold from 2024, driven by favorable power market conditions and the Cheaper Home Batteries Program, which has since installed more than 380,000 home battery systems totaling 10.7 GWh of capacity. Saudi Arabia leapfrogged several peer countries as Chinese suppliers began tapping into the kingdom's market — a development with implications well beyond storage itself, given the kingdom's broader energy strategy.
The geographic concentration matters for two reasons. First, it explains why Chinese suppliers — CATL, BYD, Sungrow, and a long tail of integrators — continue to set the price and product cadence the rest of the industry responds to. Second, it sharpens a question that financiers have been asking with increasing urgency: how durable is the China supply chain dominance under different geopolitical scenarios?
The solar-to-battery ratio is closing fast
One of the more telling data points in the BNEF analysis is the changing relationship between solar and battery deployment. In 2016, the world added 56 megawatts of solar for every 1 megawatt of batteries. By 2025, that ratio had compressed to 6:1, and BNEF expects it to narrow further to 4:1 in 2026 — partly because storage is accelerating, and partly because solar additions are slowing in some markets.
For project developers, the practical implication is that battery procurement is no longer a bolt-on consideration. It is becoming a primary planning input, often with longer lead times than the solar equipment that anchors a hybrid project.
The Iran wrinkle: limited so far, but watch the channels
The BNEF piece flagged the ongoing Middle East conflict as a wildcard for the storage industry, with a careful framing that is worth understanding precisely.
The direct impact on storage markets has been limited to date, primarily because of China's dominance in battery supply chains. Most of what the industry buys does not transit Hormuz-adjacent shipping lanes in a way that materially exposes it to the conflict.
Indirectly, however, three channels could matter. First, in competitive power markets, higher intraday power spreads driven by soaring fuel prices improve revenues for energy storage — a tailwind for assets already operating. Second, sustained increases in retail electricity prices could drive more households and businesses to install rooftop solar and batteries, as Europe saw after Russia's invasion of Ukraine. Third, on the cost side, shipping and manufacturing inputs derived from oil could rise, increasing project costs in some regions.
The honest reading is that storage has fared better than most energy infrastructure during the current geopolitical cycle, but the picture could shift if the conflict extends or escalates.
Chemistry: LFP still rules, but the next wave is forming
In 2025, lithium iron phosphate (LFP) accounted for more than 90% of stationary storage additions. That share reflects a multi-year transition from NMC chemistry, driven by safety, cycle life, and cost considerations after a series of high-profile fire incidents at NMC-based facilities.
What changes in 2026, according to BNEF, is the rise of long-duration energy storage and the industrial-scale entry of sodium-ion. Annual additions of long-duration energy storage (six hours or more) are set to quadruple to roughly 2 GW in 2026, with most of that capacity coming from non-lithium technologies and growth concentrated in China. Iron-air, organic flow, and emerging chemistries that were demonstration-scale eighteen months ago are starting to land in real procurement decisions.
Sodium-ion is the more concrete near-term story. Several technology providers have secured sodium-ion supply agreements across markets in the past year:
Newsletter World BESS - Home
- CATL and Beijing HyperStrong Technology signed a three-year partnership totaling 60 gigawatt-hours of sodium batteries in April 2026 — the largest publicly disclosed sodium-ion order to date.
- Peak Energy signed a 5 GWh sodium-ion supply agreement with Jupiter Power in 2025, with deployments scheduled between 2027 and 2030.
Sodium-ion is generally still more expensive than mature LFP today due to limited manufacturing scale, but BNEF expects costs to decline as scale ramps. The chemistry's case rests on material abundance, supply chain diversification, and stronger cold-weather performance — all of which matter more in some markets than others.
What the 100 GW milestone means for IPPs, utilities and financiers
The substantive question for anyone building or financing storage assets is what changes in practice when the industry crosses a milestone like this. A few things shift simultaneously.
Procurement becomes a competitive sport, not a vendor selection. When the world is adding 158 GW in a single year, the question is no longer "which OEM should I choose" but "can I lock in delivery slots and whose price is real." Fluence's recently disclosed $5.6 billion order backlog and 147 GWh pipeline is one signal; CATL's manufacturing concentration is another. Late buyers will find optionality compressed.
Revenue expectations need recalibration. Higher storage penetration tends to compress arbitrage margins in any given market over time as more units chase the same intraday spreads. Markets that have not yet reformed capacity remuneration mechanisms or co-optimized energy and ancillary services will see this first, and most acutely. The flip side is that grid services revenue continues to surface as renewables share rises and grid-forming capability becomes more valuable.
Financing structures are diversifying. A market that adds 158 GW in 2026 cannot be funded entirely by traditional project finance. Tolling agreements, hybrid contracts, merchant tails, and structured equity are all expanding. The BNEF numbers also imply growing comfort from institutional investors with merchant exposure in mature markets.
Geographic diversification is moving up the strategic agenda. Saudi Arabia's leapfrog, Australia's near-sixfold residential surge, and the emergence of Latin American projects (most recently Innergex's San Andrés II in Chile) suggest that the next 100 GW will be more geographically distributed than the last. Suppliers and developers without exposure to multiple markets will face concentration risk that financiers will increasingly notice.
What to watch in the rest of 2026
Five threads are worth following over the next two quarters.
First, the chemistry mix in new procurements. If the share of non-LFP chemistries in committed contracts begins to climb meaningfully above 10%, that is the signal that the chemistry shift BNEF describes is moving from forecast to operational reality.
Second, the maturation of long-duration auctions. China's LDES procurement led the global pipeline in 2025, but several Western markets — California, the UK, Germany — have LDES tenders now structured. The clearing prices in these auctions will set the reference for what 8-, 10- and 100-hour storage actually costs at industrial scale.
Third, how the Iran situation evolves. The first-order impact has been muted, but a sustained spike in oil and shipping costs could compress 2026 project margins more than the headline forecast suggests.
Fourth, the supply-side fragmentation. Morrow's bankruptcy filing in May 2026 is one data point. CATL's continued dominance is another. Watch whether European and US cell manufacturers consolidate, exit, or find specialty niches in flow batteries and sodium-ion.
Fifth, how the 4:1 solar-to-battery ratio holds up. If storage keeps accelerating while solar continues to soften in major markets, the ratio could close even faster than BNEF currently projects — with knock-on implications for hybrid project economics, transmission planning, and capacity remuneration design.
The 100-gigawatt year is in the books. The 158-gigawatt year is the one that will tell us whether 2025 was a peak or a stepping stone.
Sources: BloombergNEF, "Energy Storage Enters the 100-Gigawatt Era: Three Things to Know," by Isshu Kikuma, May 7, 2026 (https://about.bnef.com/insights/clean-energy/energy-storage-enters-the-100-gigawatt-era-three-things-to-know/); ESS News and Energy-Storage.News May 2026 deployment coverage; BloombergNEF Energy Storage Market Outlook 1H 2026; HyperStrong Technology corporate communications, https://www.hyperstrong.com/en/news/company-news/95.
Related Posts

The 100-Gigawatt Era: BloombergNEF's 2026 Numbers on Storage's Scaling Curve
BloombergNEF reports global energy storage additions reached 112 GW in 2025 — up 48% year-over-year — and forecasts 158 GW for 2026. The data reframes how fast storage is scaling relative to solar and wind, and where the next wave of growth will come from.

CATL's 60 GWh Sodium-Ion Bet Marks Storage Industry's Post-Lithium Pivot
CATL and Beijing HyperStrong signed a 60 GWh sodium-ion battery partnership in April 2026 — the largest publicly disclosed sodium-ion order to date. With LFP at 90% of stationary additions in 2025 and BloombergNEF projecting non-lithium long-duration storage to quadruple in 2026, this is the moment sodium-ion moves from chemistry experiment to industrial procurement.
CATL 60 GWh Sodium-Ion Deal: Industrial-Scale Validation for Post-Lithium
CATL's 60 GWh sodium-ion partnership with Beijing HyperStrong, announced April 2026, is the largest publicly disclosed sodium-ion order to date. It signals chemistry diversification has crossed from research milestone to commercial reality — but doesn't mean lithium iron phosphate is going anywhere.

Global BESS Market Outlook 2026: Capacity, Trends and Key Players
A data-driven look at the global battery energy storage market in 2026 — installed capacity, regional leaders, leading manufacturers and the trends shaping the next phase of growth.